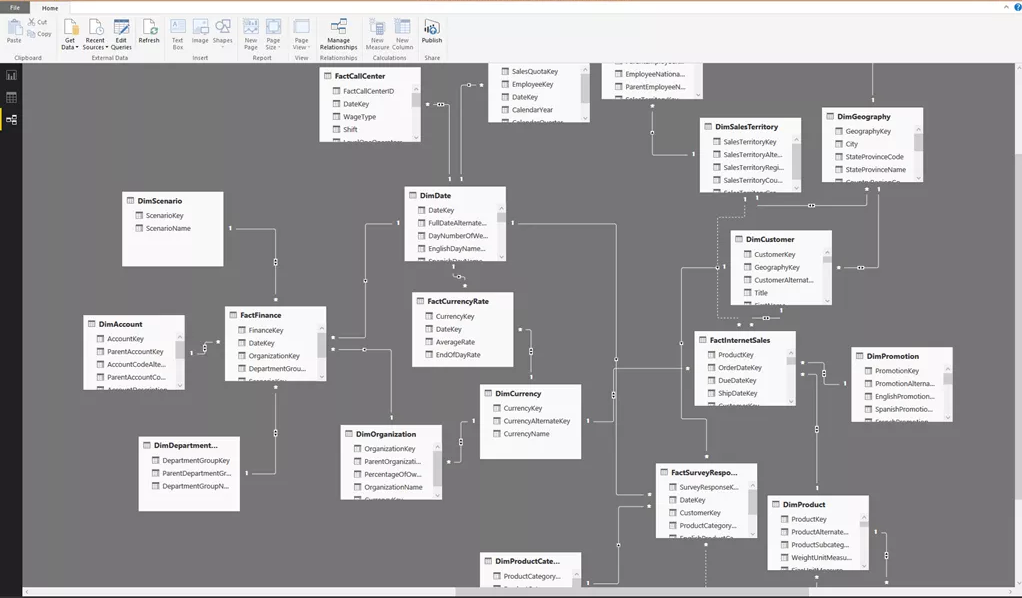
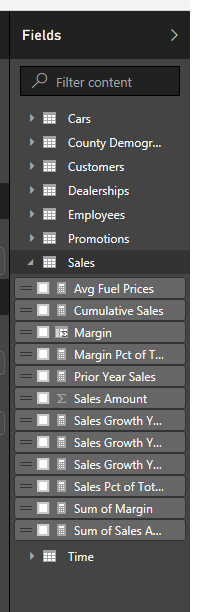
In this post I show you a simple trick to make your Power BI model more organised and more readable. I call it creating a “Measure Table”. Let me explain. The story is that I was working on a model with lots of tables. The database schema was NOT a proper star schema so there were a bunch of measures spread into lots of different tables. On top of that we’ve created lots of calculated measures with different home tables which made it really hard to find a particular measure or calculated measure. I thought, well, when it is that hard to find the calculated measures at development time how hard it could be for a customer to find, understand and use the measures we created. The visibility of the calculated measures could be an issue when we have lots of measures in lots of different tables. You will soon feel the issue in customer training sessions when you need to navigate between lots of different tables to find a calculated measure.
Consider you create a Power BI model with direct connect to a SSAS Multidimensional instance. You will immediately notice that all measure groups have a special calculation icon ( ) rather than a normal table icon (
 ) which makes the measure groups more recognisable for the end users. For instance, you can easily find any calculated measure related to “Internet Sales” under the “Internet Sales” measure group.
) rather than a normal table icon () which makes the measure groups more recognisable for the end users. For instance, you can easily find any calculated measure related to “Internet Sales” under the “Internet Sales” measure group.
I know, we can search and find the measures very easily, but, our model would be more organised and more user friendly if we can put all measures in one or more tables which contain just related calculated measures and nothing else. For instance, we can create a measure table for time intelligence calculations and name it “Sales Time Intelligence Measures” and put all calculated measures like “Sales YTD”, “Sales LYTD”, “Sales Period Over Period” on it. It will make your model nice and clean, easy to use and easy to learn for your customers. It will also help you to train your customers more easily.
In this article I’ll connect to a SQL Server instance and will use the famous Adventure Works database. I also show you how to get the job done in both “Import” and “DirectQuery” modes as there are some limitations applied to the DirectQuery mode which makes it harder to do what we want.
Lets start.
How It Works
The idea is adding a new table with just one column having just one value in that column. Then we need to hide that column. This makes the whole table get hidden as there is no columns to show. Then we use this table as “Home Table” for all related calculated measures. Remember, we do NOT hide the table, but, just the column. In this case Power BI Desktop recognises the table as a measure table so it uses the measure group icon ( ) for it.
 ) for it.
Create a Measure Table in Import Mode
- Open Power BI Desktop
- Get data
- Connect to a SQL Server Database (Adventure Works as a sample)

- Select a desired table (FactInternetSales in our case)
- Click “Select Related Tables” button
- Click “Load”

- Click “Import” then OK

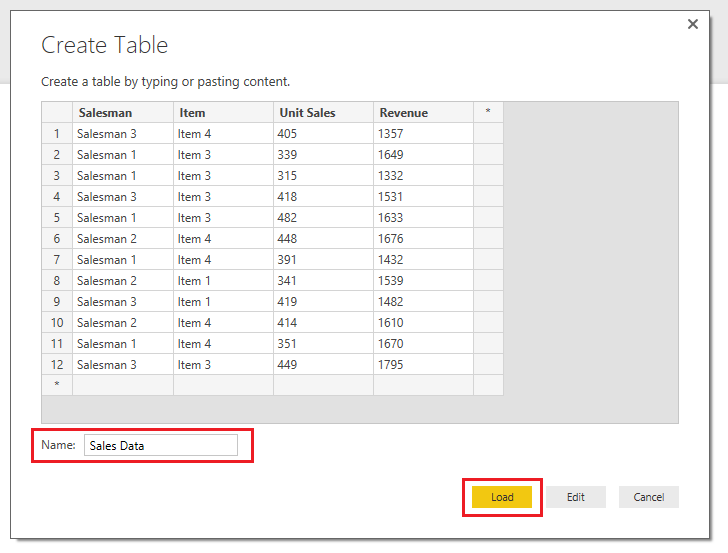
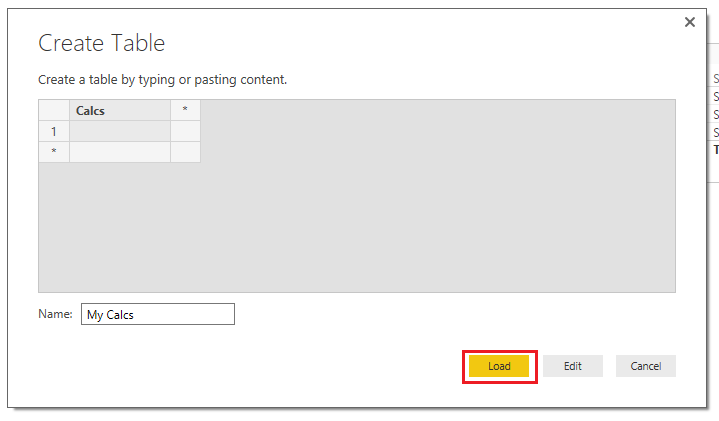
- Click “Enter Data” from Home tab

- Enter a value for “Column1”
- Enter a name for the table then click “Load”

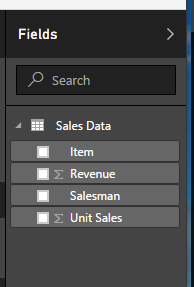
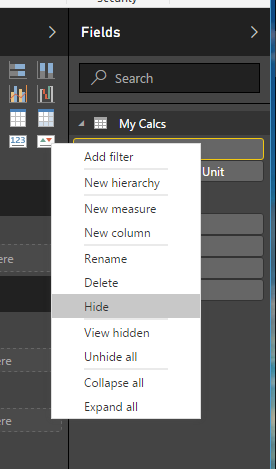
- Expand the new table from the “Fields” pane then hide the “Column1” column

- This will hide the whole table as there is no visible columns to show
- Click “New Measure” from “Modeling” tab from the ribbon to create a new calculated measure

- Type a desired DAX expression to make the new calculated measure then press enter

- This will create the calculated measure in the first table in the “Fields” pane

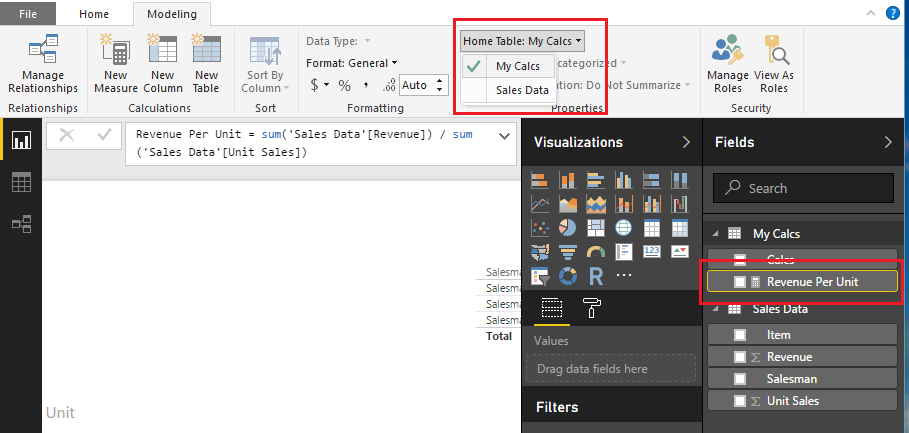
- Click on formula bar again to enable the measure properties
- Click “Home Table” and pick the newly created table from the list

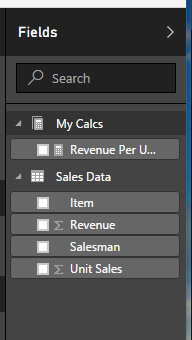
- As you can see the table appears on the “Fields” pane again with the calculated measure

- As you can see the tables still has the normal table icon, but, if you toggle right the fields pane then toggle left it the icon will be refreshed

You can create more tables like “Resellers Sales” and so on then move the calculated measures to the corresponding tables. In some cases you can hide the whole fact tables if you have created all calculated measures you need or when your customer won’t need to see any measures from the fact tables.

Create a Measure Table in DirectQuery Mode
Basically we need to do the same process, but, this time we want to connect to a SL Server database in DirectQuery mode. So to get data we do exactly the same things:
Open Power BI Desktop=> Get Data=> Connect to a SQL Server database and so on.
It is important that you enter the database name at the first step of getting data.

But, you’ll immediately notice that the “Enter Data” button is disabled in DirectQuery mode.

It’s OK. There is always an alternative way to achieve the goal.
As I mentioned before, we need to enter the database name when getting data. This is important as we’ll reuse the connection in the next steps and if we haven’t enter the database name you’ll get the following message:
“Connecting to tables from more than one database is not supported in DirectQuery mode”

OK, here is the trick.
After you connected to the SQL Server database in DirectQuery mode follow the steps below:
- Click “Edit Queries” from the ribbon

- Click “Recent Sources” then click the most recent one

- Select a table. It doesn’t matter which table you select as we’ll modify it during the next steps. Click OK

- This will add the new table in the “Queries” pane (in my sample it is “AdventureWorksDWBuildVersion”)

- Click “Advanced Editor” from “Home” tab from the ribbon


- All you need to do is to add a simple query like “[Query=”SELECT 1 AS NEW_COLUMN”]” to the source

- Now you have to comment out/remove the next line as well as the output in the “in”
- Put “Source” in the “in” block
- Do not forget to remove the comma “,” from the end of the “Source” line
- Click “Done”

- You should see a table with one column

- Rename the query then click “Close & Apply”

OK, now we have a table with just one column. From here the rest of the process is just like what we’ve done before.

- Hide the “New_Column” column
- Add a new measure then change the “Home Table” to newly created table
- Toggle right and left the task pane and you’re done

You might think
“Well… this was a bit long procedure. What if I want to create more than one measure table? Do I need to redo the whole process again and again?”
The answer is NO, you do NOT have to redo the process for each measure table you want to add to the model. All you need to do is to create a reference query from the query you already created.
To do so:
- Click “Edit Query” from the ribbon to open “Query Editor”

- Right click on the query you created previously and click “Reference”

- Rename the reference table then “Close & Apply”

- From here you need to follow the same process as explained before

- All done!